class: center, middle, inverse, title-slide # Introduction to Quantitative Genetics ## Decoding mixed model equations <br /> The 64th RBras and 18th SEAGRO Meeting ### Gota Morota <br /><a href="http://morotalab.org/" class="uri">http://morotalab.org/</a> <br /> ### 2019/8/1 --- # About me  --- # Tapioca! <img src="tapiokaBr.jpg" width=700 height=450> --- # Tapioca! <img src="tapiocaJP.jpg" width=700 height=450> --- class: inverse, center, middle # Quantitative Genetics -- Analysis of complex or multifactorial traits -- All genes affect all traits - the question is by how much? -- Infinitesimal model -- Quasi-infinitesimal model, Oligogenic model --- # What is quantitative genetics? -- Population genetics - **Mathematics** is language of population genetics, **population genetics** is language of **evolution**. -- Quantitative genetics - **Statistics** is language of quantitative genetics, **quantitative genetics** is language of **complex trait genetics**. -- **Phenotypes** first in quantitative genetics In the era of genomics, phenotype is **king** <center> <iframe src="https://giphy.com/embed/9ADoZQgs0tyww" width="400" height="200" frameBorder="0" class="giphy-embed" allowFullScreen></iframe><p><a href="https://giphy.com/gifs/obama-awesome-statistics-9ADoZQgs0tyww">via GIPHY</a></p> </center> --- # Regression model Galton (1886). Regression towards mediocrity in hereditary stature "<img src="galton1886.png" width=600 height=380> --- # Complex traits <img src="phenotype-plant.png" width=800 height=530> --- # Genetic values Quantitative genetic model: `\begin{align*} \mathbf{y} &= \mathbf{g} + \boldsymbol{\epsilon} \\ \end{align*}` where `\(\mathbf{y}\)` is the vector of observed phenotypes, `\(\mathbf{g}\)` is the vector of genetic values, and `\(\boldsymbol{\epsilon}\)` is the vector of residuals. Example: | Animal ID | y | g | e | | ------------- |:-------------:| -----:|------| | 1 | 10 | ? | ? | | 2 | 7 | ? | ? | | 3 | 12 | ? | ? | --- # Genetic values Quantitative genetic model: `\begin{align*} \mathbf{y} &= \mathbf{g} + \boldsymbol{\epsilon} \\ \end{align*}` where `\(\mathbf{y}\)` is the vector of observed phenotypes, `\(\mathbf{g}\)` is the vector of genetic values, and `\(\boldsymbol{\epsilon}\)` is the vector of residuals. Example: | Animal ID | y | g | e | | ------------- |:-------------:| -----:|------| | 1 | 10 | 5 | 5 | | 2 | 7 | 6 | 1 | | 3 | 12 | 2 | 10 | -- Phenotypes can be observed and measured but genotypic and additive genetic effects cannot --- # Source of genetic signals 1. linkage disequilibrium between QTL and SNP 2. relationship among individuals <iframe src="https://giphy.com/embed/3o7Zez01HKXvaLXiHS" width="480" height="350" frameBorder="0" class="giphy-embed" allowFullScreen></iframe><p><a href="https://giphy.com/gifs/afv-funny-fail-lol-3o7Zez01HKXvaLXiHS">via GIPHY</a></p> --- # Conventional Phenotyping 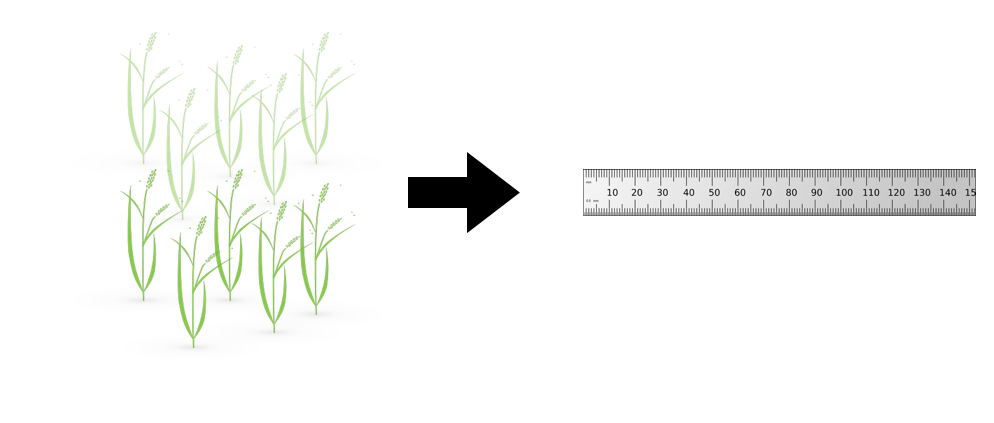 .pull-left[ - labor intensive - prone to measurement error ] .pull-right[ <iframe src="https://giphy.com/embed/Jk4ZT6R0OEUoM" width="500" height="160" frameBorder="0" class="giphy-embed" allowFullScreen></iframe><p><a href="https://giphy.com/gifs/Jk4ZT6R0OEUoM">via GIPHY</a></p> ] --- # Genomic information (e.g., SNPs)  .center[Repeat of numbers 0, 1, and 2] --- # Quantitative genetics Connecting phenotypic data with genomic information<center> <div> <img src="plant.png" width=200 height=100> = <img src="SNPs.png" width=200 height=100> + error </div> </center> `\begin{align*} \mathbf{y} &= \mathbf{g} + \boldsymbol{\epsilon} \\ &\approx \mathbf{W}\mathbf{a} + \boldsymbol{\epsilon} \end{align*}` We approximate unknown `\(\mathbf{g}\)` with `\(\mathbf{Wa}\)`. `\begin{align*} \underbrace{\begin{bmatrix} y_1\\ y_2\\ \vdots \\ y_n\end{bmatrix}}_{n \times 1} &= \underbrace{\begin{bmatrix} w_{11} & w_{12} & \cdots & w_{1m} \\ w_{21} & w_{22} & \cdots & w_{2m} \\ \vdots & \vdots & \ddots & \vdots \\ w_{n1} & w_{n2} & \cdots & w_{nm} \end{bmatrix}}_{n \times m} \quad \underbrace{\begin{bmatrix} a_1\\ a_2\\ \vdots \\ a_m\end{bmatrix}}_{m \times 1} +\underbrace{\begin{bmatrix} \epsilon_1\\ \epsilon_2\\ \vdots \\ \epsilon_m\end{bmatrix}}_{n \times 1} \end{align*}` where `\(n\)` is the number of individuals (e.g., accessions) and `\(m\)` is the number of SNPs. --- # Precision agriculture using advanced technologies 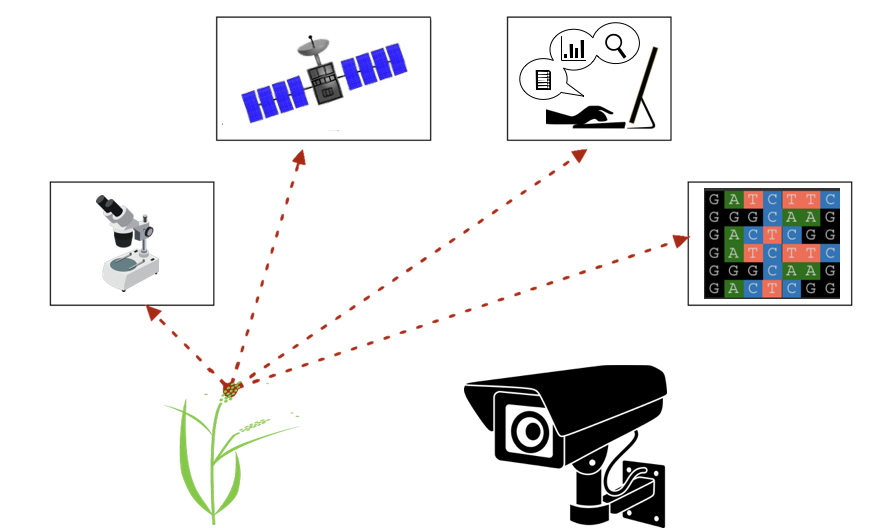 --- # Precision (digital) phenotyping 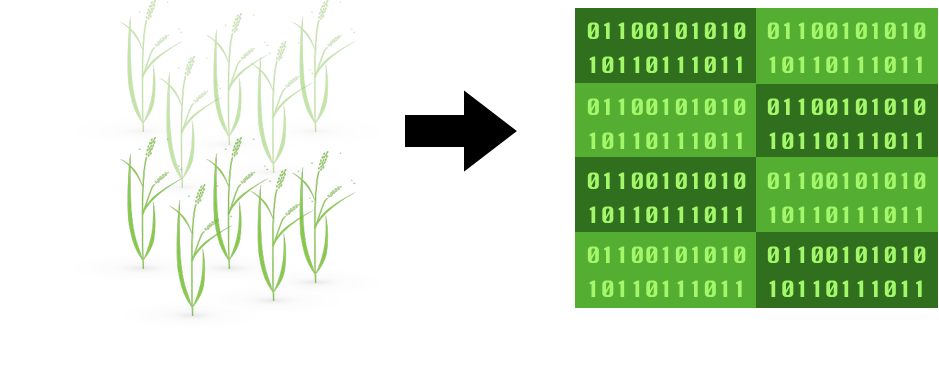 .pull-left[ - automated process - less labor intensive - less prone to measurement error ] .pull-right[ <iframe src="https://giphy.com/embed/wW95fEq09hOI8" width="400" height="160" frameBorder="0" class="giphy-embed" allowFullScreen></iframe><p><a href="https://giphy.com/gifs/chihuahua-funny-cute-wW95fEq09hOI8">via GIPHY</a></p> ] --- # Image phenotypes   .center[Image data] --- # Quantitative genetics Connecting image data with genomic information <center> <div> <img src="plant_01.png" width=100 height=100> = <img src="SNPs.png" width=100 height=100> + error </div> </center> `\begin{align*} \mathbf{y} &= \mathbf{g} + \boldsymbol{\epsilon} \\ &\approx \mathbf{W}\mathbf{a} + \boldsymbol{\epsilon} \end{align*}` We approximate unknown `\(\mathbf{g}\)` with `\(\mathbf{Wa}\)`. `\begin{align*} \underbrace{\begin{bmatrix} y_1\\ y_2\\ \vdots \\ y_n\end{bmatrix}}_{n \times 1} &= \underbrace{\begin{bmatrix} w_{11} & w_{12} & \cdots & w_{1m} \\ w_{21} & w_{22} & \cdots & w_{2m} \\ \vdots & \vdots & \ddots & \vdots \\ w_{n1} & w_{n2} & \cdots & w_{nm} \end{bmatrix}}_{n \times m} \quad \underbrace{\begin{bmatrix} a_1\\ a_2\\ \vdots \\ a_m\end{bmatrix}}_{m \times 1} +\underbrace{\begin{bmatrix} \epsilon_1\\ \epsilon_2\\ \vdots \\ \epsilon_m\end{bmatrix}}_{n \times 1} \end{align*}` where `\(n\)` is the number of individuals (e.g., accessions) and `\(m\)` is the number of SNPs. --- # Google Trends: 2012-2017  --- # Big and messy data Big data are being generated in almost every field - too large to permit visual inspection - big data `\(\ne\)` clean data - missing observations - empty cells - confounding - outliers --- # Big in n or m?  - `\(n\)`: number of individuals (records) - `\(m\)` number of SNPs (genetic markers) --- # Why we use big data in genetics? ([Makowsky et al., 2011](https://doi.org/10.1371/journal.pgen.1002051)) "<img src="makowsky1.png" width=700 height=400> --- # Why we use big data in genetics? ([Erbe et al., 2013](https://doi.org/10.1371/journal.pone.0081046)) "<img src="Erbe.png" width=700 height=400> --- # How to parameterize response variable y? - Prediction of additive genetic effects - `\(\mathbf{ y = S + a + \boldsymbol{\epsilon}}\)` - Prediction of total genetic effects **parametrically** - `\(\mathbf{ y = \mathbf{S} + \underbrace{\mathbf{ a + d + a*a + a*d + d*d}}_{g} + } \boldsymbol{\epsilon}\)` - Prediction of total genetic effects **non-parametrically** - `\(\mathbf{ y = \mathbf{S} + \mathbf{g} + \boldsymbol{\epsilon}}\)` --- # Prediction vs. Inference Complex traits are controlled by large number of genes with small effects, and influenced by both genetics and environments - Inference (location) - average effects of allele substitution - Inference (variability) - variance component estimation - genomic heritability Combination of above two (e.g., estimate proportion of additive genetic variance explained by QTLs) - Prediction - genomic selection - prediction of yet-to-be observed phenotypes --- # Prediction vs. Inference <div align="center"> <img src="Lo2015PNAS.png" width=900 height=400> </div> * [http://www.pnas.org/content/112/45/13892.abstract ](http://www.pnas.org/content/112/45/13892.abstract ) --- # GWAS vs. Prediction  .right[[Wikimedia Commons](https://commons.wikimedia.org/wiki/File:Manhattan_Plot.png)] --- # Genomic prediction - use all available markers  .center[[Meuwissen et al. (2001)](http://www.genetics.org/content/157/4/1819)] .pull-left[ - Genomic selection - Genome-enabled selection - Genome-assisted selection - Genomic prediction - Genome-enabled prediction - Genome-assisted prediction ] .pull-right[ - generation interval - prediction performance ] --- # Single trait linear mixed model `$$\mathbf{y = Xb + Zu + e}$$` <div align="center"> <img src="uni1.png" width=270 height=100> </div> - `\(\mathbf{X}\)`: incidence matrix of systematic effects - `\(\mathbf{Z}\)`: incidence matrix of random effects - `\(\mathbf{K}\)`: genomic relationship matrix - `\(\mathbf{R}\)`: residual relationship matrix - `\(\sigma^2_{u}\)`: genomic variance; `\(\sigma^2_{e}\)`: residual variance - BLUE: `\(\hat{\mathbf{b}} = (\mathbf{X'V^{-1}X})^{-}\mathbf{X'V^{-1}y}\)`; BLUP: `\(\hat{\mathbf{u}} = \mathbf{KZ'}\mathbf{V^{-1}}(\mathbf{y - X\hat{b}})\)` - where `\(\mathbf{V} = \mathbf{ZK\sigma^2_{u}Z' + R\sigma^2_{e}}\)` --- # Mixed model equations (Henderson) The corresponding mixed model equations (MME) are  - `\(\mathbf{G}^* = \sigma^2_u \mathbf{K}\)` - `\(\mathbf{R}^* = \sigma^2_e \mathbf{R}\)` If we multipy `\(\mathbf{R}^* = \sigma^2_e\mathbf{I}\)` to the both sides  where `\(\lambda = \sigma^2_e / \sigma^2_u\)` - MME produces BLUE (E-BLUE) and BLUP (E-BLUP) simultaneously --- # Decoding single trait MME | N | Phe | Env | Gen | | ------------- |:-------------:| -----:| -----:| |1| 47 | E1 | G1 | |2| 51 | E1 | G2 | |3| 46 | E1 | G3 | |4| 58 | E1 | G4 | |5| 52 | E2 | G1 | |6| 46 | E2 | G2 | |7| 52 | E2 | G3 | |8| 54 | E2 | G4 | |9| 53 | E3 | G1 | |10| 48 | E3 | G2 | |11| 58 | E3 | G3 | |12| 52 | E3 | G4 | - Credit: [Alencar Xavier @Corteva](http://alenxav.wixsite.com/home) --- # What is X? | N | EnvE1 | EnvE2 | EnvE3 | | ------------- |:-------------:| -----:| -----:| |1| 1 | 0 | 0 | |2| 1 | 0 | 0 | |3| 1 | 0 | 0 | |4| 1 | 0 | 0 | |5| 0 | 1 | 0 | |6| 0 | 1 | 0 | |7| 0 | 1 | 0 | |8| 0 | 1 | 0 | |9| 0 | 0 | 1 | |10| 0 | 0 | 1 | |11| 0 | 0 | 1 | |12| 0 | 0 | 1 | - `\(\mathbf{X}\)` is the 12 x 3 matrix --- # What is Z? | N | GenG1 | GenG2 | GenG3 | GenG4 | | ------------- |:-------------:| -----:| -----:| -----:| |1| 1 | 0 | 0 |0 | |2| 0 | 1 | 0 |0 | |3| 0 | 0 | 1 |0 | |4| 0 | 0 | 0 |1 | |5| 1 | 0 | 0 |0 | |6| 0 | 1 | 0 |0 | |7| 0 | 0 | 1 |0 | |8| 0 | 0 | 0 |1 | |9| 1 | 0 | 0 |0 | |10| 0 | 1 | 0 |0 | |11| 0 | 0 | 1 |0 | |12| 0 | 0 | 0 |1 | - `\(\mathbf{Z}\)` is the 12 x 4 matrix --- # What is X'X? - `\(\mathbf{X'}\)` is the 3 x 12 matrix - `\(\mathbf{X}\)` is the 12 x 3 matrix - `\(\mathbf{X'X}\)` is the 3 x 3 matrix | | EnvE1 | EnvE2 | EnvE3 | | ------------- |:-------------:| -----:| -----:| |EnvE1| 4 | 0 | 0 | |EnvE2| 0 | 4 | 0 | |EnvE3| 0 | 0 | 4 | -- - `\(\mathbf{X'X}\)` is the 3 x 3 diagonal matrix counting the number of phenotypes observed in each environment --- # What is X'Z? - `\(\mathbf{X'}\)` is the 3 x 12 matrix - `\(\mathbf{Z}\)` is the 12 x 4 matrix - `\(\mathbf{X'Z}\)` is the 3 x 4 matrix | | GenG1 | GenG2 | GenG3 | GenG4 | | ------------- |:-------------:| -----:| -----:| -----:| |EnvE1| 1 | 1 | 1 |1 | |EnvE2| 1 | 1 | 1 |1 | |EnvE3| 1 | 1 | 1 |1 | -- - `\(\mathbf{X'Z}\)` is the 3 x 4 matrix counting the number of each genotype in each environment --- # What is Z'X? - `\(\mathbf{Z'}\)` is the 4 x 12 matrix - `\(\mathbf{X}\)` is the 12 x 3 matrix - `\(\mathbf{X'Z}\)` is the 4 x 3 matrix | | EnvE1 | EnvE2 | EnvE3 | | ------------- |:-------------:| -----:| -----:| |GenG1| 1 | 1 | 1 | |GenG2| 1 | 1 | 1 | |GenG3| 1 | 1 | 1 | |GenG4| 1 | 1 | 1 | - `\(\mathbf{Z'X}\)` is the 4 x 3 matrix counting the number of each genotype in each environment --- # What is Z'Z? - `\(\mathbf{Z'}\)` is the 4 x 12 matrix - `\(\mathbf{Z}\)` is the 12 x 4 matrix - `\(\mathbf{Z'Z}\)` is the 4 x 4 matrix | | GenG1 | GenG2 | GenG3 | GenG4 | | ------------- |:-------------:| -----:| -----:| -----:| |GenG1| 3 | 0 | 0 |0 | |GenG2| 0 | 3 | 0 |0 | |GenG3| 0 | 0 | 3 |0 | |GenG4| 0 |0 | 0 |3| - `\(\mathbf{Z'Z}\)` is the 4 x 4 diagonal matrix counting the number of phenotypes observed for each genotype --- # What is Z'Z + `\(\lambda \mathbf{K}^{-1}\)`? - `\(\mathbf{Z'}\)` is the 4 x 12 matrix - `\(\mathbf{Z}\)` is the 12 x 4 matrix - `\(\mathbf{Z'Z}\)` is the 4 x 4 matrix -- - assume `\(\mathbf{K} = \mathbf{I}\)` (no relationship) - `\(\lambda = \sigma^2_e / \sigma^2_u = 1.64/9.56 = 0.17\)` -- | | GenG1 | GenG2 | GenG3 | GenG4 | | ------------- |:-------------:| -----:| -----:| -----:| |GenG1| 3.17 | 0 | 0 |0 | |GenG2| 0 | 3.17 | 0 |0 | |GenG3| 0 | 0 | 3.17 |0 | |GenG4| 0 |0 | 0 |3.17| - `\(\mathbf{Z'Z} + \lambda \mathbf{I}\)` is the 4 x 4 diagonal matrix counting the number of phenotypes observed for each genotype + `\(\lambda\)` value in the diagonal elements --- # What is the left hand side of MME? <div align="center"> <img src="uni4.png" width=250 height=100> </div> | | EnvE1 | EnvE2 | EnvE3 | GenG1 | GenG2 | GenG3 | GenG4 | | ------------- |:-------------:| -----:| -----:|-----:| -----:|-----:| -----:| |EnvE1| 4 | 0 | 0 |1 |1 |1 |1 | |EnvE2| 0 | 4 | 0 |1 |1 |1 |1 | |EnvE3| 0 | 0 | 4 |1 |1 |1 |1 | |GenG1| 1 | 1 | 1 |3.17 |0 |0 |0 | |GenG2| 1 | 1 | 1 |0 |3.17 |0 |0 | |GenG3| 1 | 1 | 1 |0 |0 |3.17 |0 | |GenG4| 1 | 1 | 1 |0 |0 |0 |3.17 | --- # What is X'y? - `\(\mathbf{X'}\)` is the 3 x 12 matrix - `\(\mathbf{y}\)` is the 12 x 1 matrix - `\(\mathbf{X'y}\)` is the 3 x 1 matrix | | | | ------------- |:-------------:| |EnvE1| 202 | |EnvE2| 204 | |EnvE3| 211 | -- - `\(\mathbf{X'y}\)` is the 3 x1 matrix counting the sum of phenotypes in each environment --- # What is Z'y? - `\(\mathbf{Z'}\)` is the 4 x 12 matrix - `\(\mathbf{y}\)` is the 12 x 1 matrix - `\(\mathbf{Z'y}\)` is the 4 x 1 matrix | | | | ------------- |:-------------:| |GenG1| 152 | |GenG2| 145 | |GenG3| 156 | |GenG4| 164 | -- - `\(\mathbf{Z'y}\)` is the 4 x1 matrix counting the sum of phenotypes for each genotype --- # What is the right hand side of MME? <div align="center"> <img src="uni5.png" width=100 height=100> </div> | | | | ------------- |:-------------:| |EnvE1| 202 | |EnvE2| 204 | |EnvE3| 211 | |GenG1| 152 | |GenG2| 145 | |GenG3| 156 | |GenG4| 164 | --- # Solutions  | | | | ------------- |:-------------:| |EnvE1| 50.50 | |EnvE2| 51.00 | |EnvE3| 52.75 | |GenG1| -0.71 | |GenG2| -2.92 | |GenG3| 0.55 | |GenG4| 3.08 | - These are BLUE and BLUP of environments and genotypes, respectively --- # The role of lambda BLUE = sum / `\(n_{x}\)` = the sum of phenotypes in each environment / the number of phenotypes observed in each environment - BLUE is simply computing averages BLUP = sum / `\(n_{z} + \lambda\)` = the sum of phenotypes for each genotype / the number of phenotypes observed for each genotype + `\(\lambda\)` - BLUP is shrinked toward zero (proportional to `\(\lambda\)`) -- Note that `\(\lambda = \frac{1-h^2}{h^2}\)` - More observations `\(\rightarrow\)` less shrinkage - Higher heritability `\(\rightarrow\)` less shrinkage --- # Genomic relationship matrix 1: The first type of `\(\mathbf{G}\)` matrix `\(\mathbf{G} = \frac{\mathbf{W_c}\mathbf{W_c'}}{\sum 2 p_j (1-p_j)}\)` - `\(\mathbf{W_c}\)`: centered marker matrix - `\(p_j\)`: allele frequency at `\(j\)`th marker 2: The second type of `\(\mathbf{G}\)` matrix `\(\mathbf{G} = \frac{\mathbf{W_{cs}}\mathbf{W_{cs}'}}{m}\)` - `\(\mathbf{W_{cs}}\)`: centered and scaled marker matrix - `\(m\)`: number of markers --- # Genomic relationship matrix  --- # When relationships are known Suppose `\(\mathbf{K}\)` is given by | | GenG1 | GenG2 | GenG3 | GenG4 | | ------------- |:-------------:| -----:| -----:| -----:| |GenG1| 1.00 | 0.64 | 0.23 |0.48 | |GenG2| 0.64 | 1.00 | 0.33 |0.67 | |GenG3| 0.23 | 0.33 | 1.00 |0.31 | |GenG4| 0.48 |0.67 | 0.31 |1.00| -- Then `\(\lambda \mathbf{K}^{-1}\)` is | | GenG1 | GenG2 | GenG3 | GenG4 | | ------------- |:-------------:| -----:| -----:| -----:| |GenG1| 0.15 | -0.09 | 0.00 |-0.01 | |GenG2| -0.09 | 0.22 | -0.02 |-0.10 | |GenG3| 0.00 | -0.02 | 0.10 |-0.02 | |GenG4| -0.01 |-0.10 | -0.02 |0.17| - `\(\lambda = \sigma^2_e / \sigma^2_u = 1.64/17.70 = 0.09\)` --- # What is the left hand side of MME? <div align="center"> <img src="uni4.png" width=250 height=100> </div> | | EnvE1 | EnvE2 | EnvE3 | GenG1 | GenG2 | GenG3 | GenG4 | | ------------- |:-------------:| -----:| -----:|-----:| -----:|-----:| -----:| |EnvE1| 4 | 0 | 0 |1 |1 |1 |1 | |EnvE2| 0 | 4 | 0 |1 |1 |1 |1 | |EnvE3| 0 | 0 | 4 |1 |1 |1 |1 | |GenG1| 1 | 1 | 1 |3.15 |-0.09 |0.00 |-0.01 | |GenG2| 1 | 1 | 1 |-0.09 |3.22 |-0.02 |-0.10 | |GenG3| 1 | 1 | 1 |0.00 |-0.02 |3.10 |-0.02 | |GenG4| 1 | 1 | 1 |-0.01 |-0.10 |-0.02 |3.17 | --- # When there are missing phenotypes .pull-left[ | N | Phe | Env | Gen | | ------------- |:-------------:| -----:| -----:| |1| 47 | E1 | G1 | |2| 51 | E1 | G2 | |3| NA | E1 | G3 | |4| 58 | E1 | G4 | |5| 52 | E2 | G1 | |6| 46 | E2 | G2 | |7| 52 | E2 | G3 | |8| NA | E2 | G4 | |9| 53 | E3 | G1 | |10| 48 | E3 | G2 | |11| 58 | E3 | G3 | |12| 52 | E3 | G4 | ] .pull-right[ <iframe src="https://giphy.com/embed/3o85xpBDDNSAQsbu2A" width="480" height="360" frameBorder="0" class="giphy-embed" allowFullScreen></iframe><p><a href="https://giphy.com/gifs/afvbabies-babies-afv-3o85xpBDDNSAQsbu2A">via GIPHY</a></p> ] --- # What is X? | N | EnvE1 | EnvE2 | EnvE3 | | ------------- |:-------------:| -----:| -----:| |1| 1 | 0 | 0 | |2| 1 | 0 | 0 | |4| 1 | 0 | 0 | |5| 0 | 1 | 0 | |6| 0 | 1 | 0 | |7| 0 | 1 | 0 | |9| 0 | 0 | 1 | |10| 0 | 0 | 1 | |11| 0 | 0 | 1 | |12| 0 | 0 | 1 | - Remove missing rows - `\(\mathbf{X}\)` is the 10 x 3 matrix --- # What is Z? | N | GenG1 | GenG2 | GenG3 | GenG4 | | ------------- |:-------------:| -----:| -----:| -----:| |1| 1 | 0 | 0 |0 | |2| 0 | 1 | 0 |0 | |4| 0 | 0 | 0 |1 | |5| 1 | 0 | 0 |0 | |6| 0 | 1 | 0 |0 | |7| 0 | 0 | 1 |0 | |9| 1 | 0 | 0 |0 | |10| 0 | 1 | 0 |0 | |11| 0 | 0 | 1 |0 | |12| 0 | 0 | 0 |1 | - Remove missing rows - `\(\mathbf{Z}\)` is the 10 x 4 matrix --- # What is X'X? - `\(\mathbf{X'}\)` is the 3 x 10 matrix - `\(\mathbf{X}\)` is the 10 x 3 matrix - `\(\mathbf{X'X}\)` is the 3 x 3 matrix | | EnvE1 | EnvE2 | EnvE3 | | ------------- |:-------------:| -----:| -----:| |EnvE1| 3 | 0 | 0 | |EnvE2| 0 | 3 | 0 | |EnvE3| 0 | 0 | 4 | -- - `\(\mathbf{X'X}\)` is the 3 x 3 diagonal matrix counting the number of phenotypes observed in each environment --- # What is X'Z? - `\(\mathbf{X'}\)` is the 3 x 10 matrix - `\(\mathbf{Z}\)` is the 10 x 4 matrix - `\(\mathbf{X'Z}\)` is the 3 x 4 matrix | | GenG1 | GenG2 | GenG3 | GenG4 | | ------------- |:-------------:| -----:| -----:| -----:| |EnvE1| 1 | 1 | 0 |1 | |EnvE2| 1 | 1 | 1 |0 | |EnvE3| 1 | 1 | 1 |1 | -- - `\(\mathbf{X'Z}\)` is the 3 x 4 matrix counting the number of each genotype in each environment --- # What is Z'X? - `\(\mathbf{Z'}\)` is the 4 x 10 matrix - `\(\mathbf{X}\)` is the 10 x 3 matrix - `\(\mathbf{X'Z}\)` is the 4 x 3 matrix | | EnvE1 | EnvE2 | EnvE3 | | ------------- |:-------------:| -----:| -----:| |GenG1| 1 | 1 | 1 | |GenG2| 1 | 1 | 1 | |GenG3| 0 | 1 | 1 | |GenG4| 1 | 0 | 1 | - `\(\mathbf{Z'X}\)` is the 4 x 3 matrix counting the number of each genotype in each environment --- # What is Z'Z? - `\(\mathbf{Z'}\)` is the 4 x 10 matrix - `\(\mathbf{Z}\)` is the 4 x 10 matrix - `\(\mathbf{Z'Z}\)` is the 4 x 4 matrix | | GenG1 | GenG2 | GenG3 | GenG4 | | ------------- |:-------------:| -----:| -----:| -----:| |GenG1| 3 | 0 | 0 |0 | |GenG2| 0 | 3 | 0 |0 | |GenG3| 0 | 0 | 2 |0 | |GenG4| 0 |0 | 0 |2| - `\(\mathbf{Z'Z}\)` is the 4 x 4 diagonal matrix counting the number of phenotypes observed for each genotype --- # What is the left hand side of MME? <div align="center"> <img src="uni4.png" width=250 height=100> </div> | | EnvE1 | EnvE2 | EnvE3 | GenG1 | GenG2 | GenG3 | GenG4 | | ------------- |:-------------:| -----:| -----:|-----:| -----:|-----:| -----:| |EnvE1| 3 | 0 | 0 |1 |1 |0 |1 | |EnvE2| 0 | 3 | 0 |1 |1 |1 |0 | |EnvE3| 0 | 0 | 4 |1 |1 |1 |1 | |GenG1| 1 | 1 | 1 |3.10 |-0.06 |0.00 |-0.01 | |GenG2| 1 | 1 | 1 |-0.06 |3.15 |-0.01 |-0.07 | |GenG3| 0 | 1 | 1 |0.00 |-0.01 |2.07 |-0.01 | |GenG4| 1 | 0 | 1 |-0.01 |-0.07 |-0.01 |2.11 | - `\(\lambda = \sigma^2_e / \sigma^2_u = 1.64/19.61 = 0.06\)` --- # What is the right hand side of MME? <div align="center"> <img src="uni5.png" width=100 height=100> </div> | | | | ------------- |:-------------:| |EnvE1| 156 | |EnvE2| 150 | |EnvE3| 211 | |GenG1| 152 | |GenG2| 145 | |GenG3| 110 | |GenG4| 110 | --- # The first genotype is missing phenotypes .pull-left[ | N | Phe | Env | Gen | | ------------- |:-------------:| -----:| -----:| |1| NA | E1 | G1 | |2| 51 | E1 | G2 | |3| 46 | E1 | G3 | |4| 58 | E1 | G4 | |5| NA | E2 | G1 | |6| 46 | E2 | G2 | |7| 52 | E2 | G3 | |8| 54 | E2 | G4 | |9| NA | E3 | G1 | |10| 48 | E3 | G2 | |11| 58 | E3 | G3 | |12| 52 | E3 | G4 | ] .pull-right[ <center> <iframe src="https://giphy.com/embed/lKZEeXJGhU1d6" width="300" height="350" frameBorder="0" class="giphy-embed" allowFullScreen></iframe><p><a href="https://giphy.com/gifs/scared-despicable-me-lKZEeXJGhU1d6">via GIPHY</a> </p> </center> ] --- # What is X? | N | EnvE1 | EnvE2 | EnvE3 | | ------------- |:-------------:| -----:| -----:| |2| 1 | 0 | 0 | |3| 1 | 0 | 0 | |4| 1 | 0 | 0 | |6| 0 | 1 | 0 | |7| 0 | 1 | 0 | |8| 0 | 1 | 0 | |10| 0 | 0 | 1 | |11| 0 | 0 | 1 | |12| 0 | 0 | 1 | - Remove missing rows - `\(\mathbf{X}\)` is the 9 x 3 matrix --- # What is Z? | N | GenG1 | GenG2 | GenG3 | GenG4 | | ------------- |:-------------:| -----:| -----:| -----:| |2| 0 | 1 | 0 |0 | |3| 0 | 0 | 1 |0 | |4| 0 | 0 | 0 |1 | |6| 0 | 1 | 0 |0 | |7| 0 | 0 | 1 |0 | |8| 0 | 0 | 0 |1 | |10| 0 | 1 | 0 |0 | |11| 0 | 0 | 1 |0 | |12| 0 | 0 | 0 |1 | - Remove missing rows - `\(\mathbf{Z}\)` is the 9 x 4 matrix --- # What is X'X? - `\(\mathbf{X'}\)` is the 3 x 9 matrix - `\(\mathbf{X}\)` is the 9 x 3 matrix - `\(\mathbf{X'X}\)` is the 3 x 3 matrix | | EnvE1 | EnvE2 | EnvE3 | | ------------- |:-------------:| -----:| -----:| |EnvE1| 3 | 0 | 0 | |EnvE2| 0 | 3 | 0 | |EnvE3| 0 | 0 | 3 | -- - `\(\mathbf{X'X}\)` is the 3 x 3 diagonal matrix counting the number of phenotypes observed in each environment --- # What is X'Z? - `\(\mathbf{X'}\)` is the 3 x 9 matrix - `\(\mathbf{Z}\)` is the 9 x 4 matrix - `\(\mathbf{X'Z}\)` is the 3 x 4 matrix | | GenG1 | GenG2 | GenG3 | GenG4 | | ------------- |:-------------:| -----:| -----:| -----:| |EnvE1| 0 | 1 | 1 |1 | |EnvE2| 0 | 1 | 1 |1 | |EnvE3| 0 | 1 | 1 |1 | -- - `\(\mathbf{X'Z}\)` is the 3 x 4 matrix counting the number of each genotype in each environment --- # What is Z'X? - `\(\mathbf{Z'}\)` is the 4 x 12 matrix - `\(\mathbf{X}\)` is the 12 x 3 matrix - `\(\mathbf{X'Z}\)` is the 4 x 3 matrix | | EnvE1 | EnvE2 | EnvE3 | | ------------- |:-------------:| -----:| -----:| |GenG1| 0 | 0 | 0 | |GenG2| 1 | 1 | 1 | |GenG3| 1 | 1 | 1 | |GenG4| 1 | 1 | 1 | - `\(\mathbf{Z'X}\)` is the 4 x 3 matrix counting the number of each genotype in each environment --- # What is Z'Z? - `\(\mathbf{Z'}\)` is the 4 x 9 matrix - `\(\mathbf{Z}\)` is the 4 x 9 matrix - `\(\mathbf{Z'Z}\)` is the 4 x 4 matrix | | GenG1 | GenG2 | GenG3 | GenG4 | | ------------- |:-------------:| -----:| -----:| -----:| |GenG1| 0 | 0 | 0 |0 | |GenG2| 0 | 3 | 0 |0 | |GenG3| 0 | 0 | 3 |0 | |GenG4| 0 |0 | 0 |3| - `\(\mathbf{Z'Z}\)` is the 4 x 4 diagonal matrix counting the number of phenotypes observed for each genotype --- # What is the left hand side of MME? <div align="center"> <img src="uni4.png" width=250 height=100> </div> | | EnvE1 | EnvE2 | EnvE3 | GenG1 | GenG2 | GenG3 | GenG4 | | ------------- |:-------------:| -----:| -----:|-----:| -----:|-----:| -----:| |EnvE1| 3 | 0 | 0 |0 |1 |0 |1 | |EnvE2| 0 | 3 | 0 |0 |1 |1 |0 | |EnvE3| 0 | 0 | 3 |0 |1 |1 |1 | |GenG1| 0 | 0 | 0 |0.14 |-0.08 |0.00 |-0.01 | |GenG2| 1 | 1 | 1 |-0.08 |3.19 |-0.02 |-0.09 | |GenG3| 0 | 1 | 1 |0.00 |-0.02 |3.09 |-0.01 | |GenG4| 1 | 0 | 1 |-0.01 |-0.09 |-0.01 |3.15 | - `\(\lambda = \sigma^2_e / \sigma^2_u = 1.79/22.78 = 0.08\)` --- # What is the right hand side of MME? <div align="center"> <img src="uni5.png" width=100 height=100> </div> | | | | ------------- |:-------------:| |EnvE1| 155 | |EnvE2| 152 | |EnvE3| 158 | |GenG1| 0 | |GenG2| 145 | |GenG3| 156 | |GenG4| 164 | --- # Solutions  | | | | ------------- |:-------------:| |EnvE1| 52.06 | |EnvE2| 51.06 | |EnvE3| 53.06 | |GenG1| -1.82 | |GenG2| -3.48 | |GenG3| -0.07 | |GenG4| 2.38 | - These are BLUE and BLUP of environments and genotypes, respectively --- # Dimension of left hand side <div align="center"> <img src="equDecoded.png" width=300 height=250> </div> .pull-left[ - s: number of unique fixed effects - q: number of unique genotypes - does not depend on `\(n\)` ] .pull-right[ <center> <iframe src="https://giphy.com/embed/UgD64OxiNyTBK" width="421" height="250" frameBorder="0" class="giphy-embed" allowFullScreen></iframe><p><a href="https://giphy.com/gifs/funny-lol-guitarhero-UgD64OxiNyTBK">via GIPHY</a></p> </center> ] --- # Extending a linear mixed model for GWAS Previous model `$$\mathbf{y = Xb + Zu + e}$$` </br> Linear mixed model single-marker regression `$$\mathbf{y = Xb + Wa + Zu + e}$$` - `\(\mathbf{W}\)`: marker matrix - `\(\mathbf{a}\)`: vector of marker effect --- # Linear mixed model for GWAS Single marker-based mixed model association (MMA) `\begin{align*} \mathbf{y} &= \mu + \mathbf{w_ja_j} + \mathbf{Zg} + \boldsymbol{\epsilon} \\ \mathbf{g} &\sim N(0, \mathbf{G}\sigma^2_{g}) \end{align*}` `\(\mathbf{G}\)` captures population structure and polygenic effects -- Double counting? -- Alternatively, `\begin{align*} \mathbf{y} &= \mu + \mathbf{w_ja_j} + \mathbf{Zg} + \boldsymbol{\epsilon} \\ \mathbf{g} &\sim N(0, \mathbf{G}_{-k}\sigma^2_{g_{-k}}) \end{align*}` where `\(-k\)` denotes the `\(k\)`th chromosome removed See * Rincent et al. 2014. ([10.1534/genetics.113.159731](https://doi.org/10.1534/genetics.113.159731)) * Chen and Lipka. 2016. ([10.1534/g3.116.029090](https://doi.org/10.1534/g3.116.029090)) --- # How to solve the linear mixed model? 1: Mixed model equations (MME) `\begin{align*} \mathbf{y} &= \mu + \mathbf{w_ja_j} + \mathbf{Zg} + \boldsymbol{\epsilon} \\ \end{align*}` The mixed model equations of [Henderson (1949)](http://morotalab.org/literature/pdf/henderson1949.pdf) are given by <div align="center"> <img src="MME2.png" width=600 height=100> </div> 2: Weighted least squares `\begin{align*} \hat{\mathbf{a}} &= (\mathbf{W'U T U'W})^{-1}\mathbf{W'U} \mathbf{T} \mathbf{U'y} \end{align*}` where - `\(\mathbf{U}\)`: eigenvectors of the `\(\mathbf{G}\)` matrix - `\(\mathbf{D}\)`: eigenvalues of the `\(\mathbf{G}\)` matrix `\begin{align*} \mathbf{T} = [\mathbf{D} + \lambda \mathbf{I} ]^{-1} \end{align*}` --- # Important literature Animal * [Kennedy et al. 1992.](https://doi.org/10.2527/1992.7072000x) Estimation of effects of single genes on quantitative traits. J Anim Sci. 70:2000-2012. Plant * [Yu et al. 2006.](https://dx.doi.org/10.1038/ng1702) A unified mixed-model method for association mapping that accounts for multiple levels of relatedness. Nat Genet. 38:203-208. --- # Bibliography 