class: center, middle, inverse, title-slide # Multi-trait methods for GWAS and genomic prediction ## Statistical Methods for Omics-assisted Breeding Hands-on Workshop ### Gota Morota <br /><a href="http://morotalab.org/" class="uri">http://morotalab.org/</a> <br /> ### 2018/11/15 --- # Single trait GBLUP model `$$\mathbf{y_{1} = X_{1}b_{1} + Z_{1}u_{1} + e_{1}}$$` <div align="center"> <img src="uni1.png" width=270 height=100> </div> - `\(\mathbf{K}\)`: genomic relationship matrix - `\(\mathbf{R}\)`: residual relationship matrix - `\(\sigma^2_{u_1}\)`: genomic variance - `\(\sigma^2_{e_1}\)`: residual variance --- # Single trait GBLUP model The corresponding mixed model equations (MME) are  - `\(\mathbf{G}^* = \sigma^2_u \mathbf{K}\)` - `\(\mathbf{R}^* = \sigma^2_e \mathbf{R}\)` If we multipy `\(\mathbf{R}^* = \sigma^2_e\mathbf{I}\)` to the both sides  where `\(\lambda = \sigma^2_e / \sigma^2_u\)` - MME produces BLUE (E-BLUE) and BLUP (E-BLUP) simultaneously --- # Decoding single trait MME | ID | Phe | Env | Gen | | ------------- |:-------------:| -----:| -----:| |1| 47 | E1 | G1 | |2| 51 | E1 | G2 | |3| 46 | E1 | G3 | |4| 58 | E1 | G4 | |5| 52 | E2 | G1 | |6| 46 | E2 | G2 | |7| 52 | E2 | G3 | |8| 54 | E2 | G4 | |9| 53 | E3 | G1 | |10| 48 | E3 | G2 | |11| 58 | E3 | G3 | |12| 52 | E3 | G4 | - Credit: [Alencar Xavier @Corteva](http://alenxav.wixsite.com/home) --- # What is X? | ID | EnvE1 | EnvE2 | EnvE3 | | ------------- |:-------------:| -----:| -----:| |1| 1 | 0 | 0 | |2| 1 | 0 | 0 | |3| 1 | 0 | 0 | |4| 1 | 0 | 0 | |5| 0 | 1 | 0 | |6| 0 | 1 | 0 | |7| 0 | 1 | 0 | |8| 0 | 1 | 0 | |9| 0 | 0 | 1 | |10| 0 | 0 | 1 | |11| 0 | 0 | 1 | |12| 0 | 0 | 1 | - `\(\mathbf{X}\)` is the 12 x 3 matrix --- # What is Z? | ID | GenG1 | GenG2 | GenG3 | GenG4 | | ------------- |:-------------:| -----:| -----:| -----:| |1| 1 | 0 | 0 |0 | |2| 0 | 1 | 0 |0 | |3| 0 | 0 | 1 |0 | |4| 0 | 0 | 0 |1 | |5| 1 | 0 | 0 |0 | |6| 0 | 1 | 0 |0 | |7| 0 | 0 | 1 |0 | |8| 0 | 0 | 0 |1 | |9| 1 | 0 | 0 |0 | |10| 0 | 1 | 0 |0 | |11| 0 | 0 | 1 |0 | |12| 0 | 0 | 0 |1 | - `\(\mathbf{Z}\)` is the 12 x 4 matrix --- # What is X'X? - `\(\mathbf{X'}\)` is the 3 x 12 matrix - `\(\mathbf{X}\)` is the 12 x 3 matrix - `\(\mathbf{X'X}\)` is the 3 x 3 matrix | | EnvE1 | EnvE2 | EnvE3 | | ------------- |:-------------:| -----:| -----:| |EnvE1| 4 | 0 | 0 | |EnvE2| 0 | 4 | 0 | |EnvE3| 0 | 0 | 4 | -- - `\(\mathbf{X'X}\)` is the 3 x 3 diagonal matrix counting the number of phenotypes observed in each environment --- # What is X'Z? - `\(\mathbf{X'}\)` is the 3 x 12 matrix - `\(\mathbf{Z}\)` is the 12 x 4 matrix - `\(\mathbf{X'Z}\)` is the 3 x 4 matrix | | GenG1 | GenG2 | GenG3 | GenG4 | | ------------- |:-------------:| -----:| -----:| -----:| |EnvE1| 1 | 1 | 1 |1 | |EnvE2| 1 | 1 | 1 |1 | |EnvE3| 1 | 1 | 1 |1 | -- - `\(\mathbf{X'Z}\)` is the 3 x 4 matrix counting the number of each genotype in each environment --- # What is Z'X? - `\(\mathbf{Z'}\)` is the 4 x 12 matrix - `\(\mathbf{X}\)` is the 12 x 3 matrix - `\(\mathbf{X'Z}\)` is the 4 x 3 matrix | | EnvE1 | EnvE2 | EnvE3 | | ------------- |:-------------:| -----:| -----:| |GenG1| 1 | 1 | 1 | |GenG2| 1 | 1 | 1 | |GenG3| 1 | 1 | 1 | |GenG4| 1 | 1 | 1 | - `\(\mathbf{Z'X}\)` is the 4 x 3 matrix counting the number of each genotype in each environment --- # What is Z'Z? - `\(\mathbf{Z'}\)` is the 4 x 12 matrix - `\(\mathbf{Z}\)` is the 4 x 12 matrix - `\(\mathbf{Z'Z}\)` is the 4 x 4 matrix | | GenG1 | GenG2 | GenG3 | GenG4 | | ------------- |:-------------:| -----:| -----:| -----:| |GenG1| 3 | 0 | 0 |0 | |GenG2| 0 | 3 | 0 |0 | |GenG3| 0 | 0 | 3 |0 | |GenG4| 0 |0 | 0 |3| - `\(\mathbf{Z'Z}\)` is the 4 x 4 diagonal matrix counting the number of phenotypes observed for each genotype --- # What is Z'Z + `\(\lambda \mathbf{K}^{-1}\)`? - `\(\mathbf{Z'}\)` is the 4 x 12 matrix - `\(\mathbf{Z}\)` is the 4 x 12 matrix - `\(\mathbf{Z'Z}\)` is the 4 x 4 matrix -- - assume `\(\mathbf{K} = \mathbf{I}\)` (no relationship) - `\(\lambda = \sigma^2_e / \sigma^2_u = 1.64/9.56 = 0.17\)` -- | | GenG1 | GenG2 | GenG3 | GenG4 | | ------------- |:-------------:| -----:| -----:| -----:| |GenG1| 3.17 | 0 | 0 |0 | |GenG2| 0 | 3.17 | 0 |0 | |GenG3| 0 | 0 | 3.17 |0 | |GenG4| 0 |0 | 0 |3.17| - `\(\mathbf{Z'Z} + \lambda \mathbf{I}\)` is the 4 x 4 diagonal matrix counting the number of phenotypes observed for each genotype + `\(\lambda\)` value in the diagonal elements --- # What is the left hand side of MME? <div align="center"> <img src="uni4.png" width=250 height=100> </div> | | EnvE1 | EnvE2 | EnvE3 | GenG1 | GenG2 | GenG3 | GenG4 | | ------------- |:-------------:| -----:| -----:|-----:| -----:|-----:| -----:| |EnvE1| 4 | 0 | 0 |1 |1 |1 |1 | |EnvE2| 0 | 4 | 0 |1 |1 |1 |1 | |EnvE3| 0 | 0 | 4 |1 |1 |1 |1 | |GenG1| 1 | 1 | 1 |3.17 |0 |0 |0 | |GenG2| 1 | 1 | 1 |0 |3.17 |0 |0 | |GenG3| 1 | 1 | 1 |0 |0 |3.17 |0 | |GenG4| 1 | 1 | 1 |0 |0 |0 |3.17 | --- # What is X'y? - `\(\mathbf{X'}\)` is the 3 x 12 matrix - `\(\mathbf{y}\)` is the 12 x 1 matrix - `\(\mathbf{X'y}\)` is the 3 x 1 matrix | | | | ------------- |:-------------:| |EnvE1| 202 | |EnvE2| 204 | |EnvE3| 211 | -- - `\(\mathbf{X'y}\)` is the 3 x1 matrix counting the sum of phenotypes in each environment --- # What is Z'y? - `\(\mathbf{Z'}\)` is the 4 x 12 matrix - `\(\mathbf{y}\)` is the 12 x 1 matrix - `\(\mathbf{Z'y}\)` is the 4 x 1 matrix | | | | ------------- |:-------------:| |GenG1| 152 | |GenG2| 145 | |GenG3| 156 | |GenG4| 164 | -- - `\(\mathbf{Z'y}\)` is the 4 x1 matrix counting the sum of phenotypes for each genotype --- # What is the right hand side of MME? <div align="center"> <img src="uni5.png" width=100 height=100> </div> | | | | ------------- |:-------------:| |EnvE1| 202 | |EnvE2| 204 | |EnvE3| 211 | |GenG1| 152 | |GenG2| 145 | |GenG3| 156 | |GenG4| 164 | --- # Solutions  | | | | ------------- |:-------------:| |EnvE1| 50.50 | |EnvE2| 51.00 | |EnvE3| 52.75 | |GenG1| -0.71 | |GenG2| -2.92 | |GenG3| 0.55 | |GenG4| 3.08 | - These are BLUE and BLUP of environments and genotypes, respectively --- # The role of lambda BLUE = sum / `\(n_{x}\)` = the sum of phenotypes in each environment / the number of phenotypes observed in each environment - BLUE is simply computing averages BLUP = sum / `\(n_{z} + \lambda\)` = the sum of phenotypes for each genotype / the number of phenotypes observed for each genotype + `\(\lambda\)` - BLUP is shrinked toward zero (proportional to `\(\lambda\)`) -- Note that `\(\lambda = \frac{1-h^2}{h^2}\)` - More observations `\(\rightarrow\)` less shrinkage - Higher heritability `\(\rightarrow\)` less shrinkage --- # When relationships are known Suppose `\(\mathbf{K}\)` is given by | | GenG1 | GenG2 | GenG3 | GenG4 | | ------------- |:-------------:| -----:| -----:| -----:| |GenG1| 1.00 | 0.64 | 0.23 |0.48 | |GenG2| 0.64 | 1.00 | 0.33 |0.67 | |GenG3| 0.23 | 0.33 | 1.00 |0.31 | |GenG4| 0.48 |0.67 | 0.31 |1.00| -- Then `\(\lambda \mathbf{K}^{-1}\)` is | | GenG1 | GenG2 | GenG3 | GenG4 | | ------------- |:-------------:| -----:| -----:| -----:| |GenG1| 0.15 | -0.09 | 0.00 |-0.01 | |GenG2| -0.09 | 0.22 | -0.02 |-0.10 | |GenG3| 0.00 | -0.02 | 0.10 |-0.02 | |GenG4| -0.01 |-0.10 | -0.02 |0.17| - `\(\lambda = \sigma^2_e / \sigma^2_u = 1.64/17.70 = 0.09\)` --- # What is the left hand side of MME? <div align="center"> <img src="uni4.png" width=250 height=100> </div> | | EnvE1 | EnvE2 | EnvE3 | GenG1 | GenG2 | GenG3 | GenG4 | | ------------- |:-------------:| -----:| -----:|-----:| -----:|-----:| -----:| |EnvE1| 4 | 0 | 0 |1 |1 |1 |1 | |EnvE2| 0 | 4 | 0 |1 |1 |1 |1 | |EnvE3| 0 | 0 | 4 |1 |1 |1 |1 | |GenG1| 1 | 1 | 1 |3.15 |-0.09 |0.00 |-0.01 | |GenG2| 1 | 1 | 1 |-0.09 |3.22 |-0.02 |-0.10 | |GenG3| 1 | 1 | 1 |0.00 |-0.02 |3.10 |-0.02 | |GenG4| 1 | 1 | 1 |-0.01 |-0.10 |-0.02 |3.17 | --- # When there are missing phenotypes | ID | Phe | Env | Gen | | ------------- |:-------------:| -----:| -----:| |1| 47 | E1 | G1 | |2| 51 | E1 | G2 | |3| NA | E1 | G3 | |4| 58 | E1 | G4 | |5| 52 | E2 | G1 | |6| 46 | E2 | G2 | |7| 52 | E2 | G3 | |8| NA | E2 | G4 | |9| 53 | E3 | G1 | |10| 48 | E3 | G2 | |11| 58 | E3 | G3 | |12| 52 | E3 | G4 | --- # What is X? | ID | EnvE1 | EnvE2 | EnvE3 | | ------------- |:-------------:| -----:| -----:| |1| 1 | 0 | 0 | |2| 1 | 0 | 0 | |4| 1 | 0 | 0 | |5| 0 | 1 | 0 | |6| 0 | 1 | 0 | |7| 0 | 1 | 0 | |9| 0 | 0 | 1 | |10| 0 | 0 | 1 | |11| 0 | 0 | 1 | |12| 0 | 0 | 1 | - Remove missing rows - `\(\mathbf{X}\)` is the 10 x 3 matrix --- # What is Z? | ID | GenG1 | GenG2 | GenG3 | GenG4 | | ------------- |:-------------:| -----:| -----:| -----:| |1| 1 | 0 | 0 |0 | |2| 0 | 1 | 0 |0 | |4| 0 | 0 | 0 |1 | |5| 1 | 0 | 0 |0 | |6| 0 | 1 | 0 |0 | |7| 0 | 0 | 1 |0 | |9| 1 | 0 | 0 |0 | |10| 0 | 1 | 0 |0 | |11| 0 | 0 | 1 |0 | |12| 0 | 0 | 0 |1 | - Remove missing rows - `\(\mathbf{Z}\)` is the 10 x 4 matrix --- # What is X'X? - `\(\mathbf{X'}\)` is the 3 x 10 matrix - `\(\mathbf{X}\)` is the 10 x 3 matrix - `\(\mathbf{X'X}\)` is the 3 x 3 matrix | | EnvE1 | EnvE2 | EnvE3 | | ------------- |:-------------:| -----:| -----:| |EnvE1| 3 | 0 | 0 | |EnvE2| 0 | 3 | 0 | |EnvE3| 0 | 0 | 4 | -- - `\(\mathbf{X'X}\)` is the 3 x 3 diagonal matrix counting the number of phenotypes observed in each environment --- # What is X'Z? - `\(\mathbf{X'}\)` is the 3 x 10 matrix - `\(\mathbf{Z}\)` is the 10 x 4 matrix - `\(\mathbf{X'Z}\)` is the 3 x 4 matrix | | GenG1 | GenG2 | GenG3 | GenG4 | | ------------- |:-------------:| -----:| -----:| -----:| |EnvE1| 1 | 1 | 0 |1 | |EnvE2| 1 | 1 | 1 |0 | |EnvE3| 1 | 1 | 1 |1 | -- - `\(\mathbf{X'Z}\)` is the 3 x 4 matrix counting the number of each genotype in each environment --- # What is Z'X? - `\(\mathbf{Z'}\)` is the 4 x 10 matrix - `\(\mathbf{X}\)` is the 10 x 3 matrix - `\(\mathbf{X'Z}\)` is the 4 x 3 matrix | | EnvE1 | EnvE2 | EnvE3 | | ------------- |:-------------:| -----:| -----:| |GenG1| 1 | 1 | 1 | |GenG2| 1 | 1 | 1 | |GenG3| 0 | 1 | 1 | |GenG4| 1 | 0 | 1 | - `\(\mathbf{Z'X}\)` is the 4 x 3 matrix counting the number of each genotype in each environment --- # What is Z'Z? - `\(\mathbf{Z'}\)` is the 4 x 10 matrix - `\(\mathbf{Z}\)` is the 4 x 10 matrix - `\(\mathbf{Z'Z}\)` is the 4 x 4 matrix | | GenG1 | GenG2 | GenG3 | GenG4 | | ------------- |:-------------:| -----:| -----:| -----:| |GenG1| 3 | 0 | 0 |0 | |GenG2| 0 | 3 | 0 |0 | |GenG3| 0 | 0 | 2 |0 | |GenG4| 0 |0 | 0 |2| - `\(\mathbf{Z'Z}\)` is the 4 x 4 diagonal matrix counting the number of phenotypes observed for each genotype --- # What is the left hand side of MME? <div align="center"> <img src="uni4.png" width=250 height=100> </div> | | EnvE1 | EnvE2 | EnvE3 | GenG1 | GenG2 | GenG3 | GenG4 | | ------------- |:-------------:| -----:| -----:|-----:| -----:|-----:| -----:| |EnvE1| 3 | 0 | 0 |1 |1 |0 |1 | |EnvE2| 0 | 3 | 0 |1 |1 |1 |0 | |EnvE3| 0 | 0 | 4 |1 |1 |1 |1 | |GenG1| 1 | 1 | 1 |3.10 |-0.06 |0.00 |-0.01 | |GenG2| 1 | 1 | 1 |-0.06 |3.15 |-0.01 |-0.07 | |GenG3| 0 | 1 | 1 |0.00 |-0.01 |2.07 |-0.01 | |GenG4| 1 | 0 | 1 |-0.01 |-0.07 |-0.01 |2.11 | - `\(\lambda = \sigma^2_e / \sigma^2_u = 1.64/19.61 = 0.06\)` --- # What is the right hand side of MME? <div align="center"> <img src="uni5.png" width=100 height=100> </div> | | | | ------------- |:-------------:| |EnvE1| 156 | |EnvE2| 150 | |EnvE3| 211 | |GenG1| 152 | |GenG2| 145 | |GenG3| 110 | |GenG4| 110 | --- # The first genotype is missing phenotypes | ID | Phe | Env | Gen | | ------------- |:-------------:| -----:| -----:| |1| NA | E1 | G1 | |2| 51 | E1 | G2 | |3| 46 | E1 | G3 | |4| 58 | E1 | G4 | |5| NA | E2 | G1 | |6| 46 | E2 | G2 | |7| 52 | E2 | G3 | |8| 54 | E2 | G4 | |9| NA | E3 | G1 | |10| 48 | E3 | G2 | |11| 58 | E3 | G3 | |12| 52 | E3 | G4 | --- # What is X? | ID | EnvE1 | EnvE2 | EnvE3 | | ------------- |:-------------:| -----:| -----:| |2| 1 | 0 | 0 | |3| 1 | 0 | 0 | |4| 1 | 0 | 0 | |6| 0 | 1 | 0 | |7| 0 | 1 | 0 | |8| 0 | 1 | 0 | |10| 0 | 0 | 1 | |11| 0 | 0 | 1 | |12| 0 | 0 | 1 | - Remove missing rows - `\(\mathbf{X}\)` is the 9 x 3 matrix --- # What is Z? | ID | GenG1 | GenG2 | GenG3 | GenG4 | | ------------- |:-------------:| -----:| -----:| -----:| |2| 0 | 1 | 0 |0 | |3| 0 | 0 | 1 |0 | |4| 0 | 0 | 0 |1 | |6| 0 | 1 | 0 |0 | |7| 0 | 0 | 1 |0 | |8| 0 | 0 | 0 |1 | |10| 0 | 1 | 0 |0 | |11| 0 | 0 | 1 |0 | |12| 0 | 0 | 0 |1 | - Remove missing rows - `\(\mathbf{Z}\)` is the 9 x 4 matrix --- # What is X'X? - `\(\mathbf{X'}\)` is the 3 x 9 matrix - `\(\mathbf{X}\)` is the 9 x 3 matrix - `\(\mathbf{X'X}\)` is the 3 x 3 matrix | | EnvE1 | EnvE2 | EnvE3 | | ------------- |:-------------:| -----:| -----:| |EnvE1| 3 | 0 | 0 | |EnvE2| 0 | 3 | 0 | |EnvE3| 0 | 0 | 3 | -- - `\(\mathbf{X'X}\)` is the 3 x 3 diagonal matrix counting the number of phenotypes observed in each environment --- # What is X'Z? - `\(\mathbf{X'}\)` is the 3 x 9 matrix - `\(\mathbf{Z}\)` is the 9 x 4 matrix - `\(\mathbf{X'Z}\)` is the 3 x 4 matrix | | GenG1 | GenG2 | GenG3 | GenG4 | | ------------- |:-------------:| -----:| -----:| -----:| |EnvE1| 0 | 1 | 1 |1 | |EnvE2| 0 | 1 | 1 |1 | |EnvE3| 0 | 1 | 1 |1 | -- - `\(\mathbf{X'Z}\)` is the 3 x 4 matrix counting the number of each genotype in each environment --- # What is Z'X? - `\(\mathbf{Z'}\)` is the 4 x 12 matrix - `\(\mathbf{X}\)` is the 12 x 3 matrix - `\(\mathbf{X'Z}\)` is the 4 x 3 matrix | | EnvE1 | EnvE2 | EnvE3 | | ------------- |:-------------:| -----:| -----:| |GenG1| 0 | 0 | 0 | |GenG2| 1 | 1 | 1 | |GenG3| 1 | 1 | 1 | |GenG4| 1 | 1 | 1 | - `\(\mathbf{Z'X}\)` is the 4 x 3 matrix counting the number of each genotype in each environment --- # What is Z'Z? - `\(\mathbf{Z'}\)` is the 4 x 9 matrix - `\(\mathbf{Z}\)` is the 4 x 9 matrix - `\(\mathbf{Z'Z}\)` is the 4 x 4 matrix | | GenG1 | GenG2 | GenG3 | GenG4 | | ------------- |:-------------:| -----:| -----:| -----:| |GenG1| 0 | 0 | 0 |0 | |GenG2| 0 | 3 | 0 |0 | |GenG3| 0 | 0 | 3 |0 | |GenG4| 0 |0 | 0 |3| - `\(\mathbf{Z'Z}\)` is the 4 x 4 diagonal matrix counting the number of phenotypes observed for each genotype --- # What is the left hand side of MME? <div align="center"> <img src="uni4.png" width=250 height=100> </div> | | EnvE1 | EnvE2 | EnvE3 | GenG1 | GenG2 | GenG3 | GenG4 | | ------------- |:-------------:| -----:| -----:|-----:| -----:|-----:| -----:| |EnvE1| 3 | 0 | 0 |0 |1 |0 |1 | |EnvE2| 0 | 3 | 0 |0 |1 |1 |0 | |EnvE3| 0 | 0 | 3 |0 |1 |1 |1 | |GenG1| 0 | 0 | 0 |0.14 |-0.08 |0.00 |-0.01 | |GenG2| 1 | 1 | 1 |-0.08 |3.19 |-0.02 |-0.09 | |GenG3| 0 | 1 | 1 |0.00 |-0.02 |3.09 |-0.01 | |GenG4| 1 | 0 | 1 |-0.01 |-0.09 |-0.01 |3.15 | - `\(\lambda = \sigma^2_e / \sigma^2_u = 1.79/22.78 = 0.08\)` --- # What is the right hand side of MME? <div align="center"> <img src="uni5.png" width=100 height=100> </div> | | | | ------------- |:-------------:| |EnvE1| 155 | |EnvE2| 152 | |EnvE3| 158 | |GenG1| 0 | |GenG2| 145 | |GenG3| 156 | |GenG4| 164 | --- # Solutions  | | | | ------------- |:-------------:| |EnvE1| 52.06 | |EnvE2| 51.06 | |EnvE3| 53.06 | |GenG1| -1.82 | |GenG2| -3.48 | |GenG3| -0.07 | |GenG4| 2.38 | - These are BLUE and BLUP of environments and genotypes, respectively --- # Multi-trait GBLUP model `$$\mathbf{y_{1} = X_{1}b_{1} + Z_{1}u_{1} + e_{1}}$$` `$$\mathbf{y_{2} = X_{2}b_{2} + Z_{2}u_{2} + e_{2}}$$` Individuals within traits  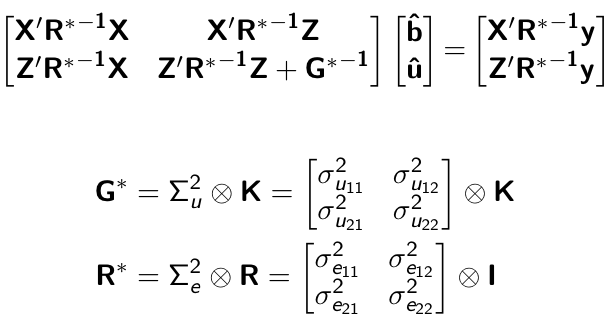 --- # Multi-trait RR-BLUP model `$$\mathbf{y_{1} = X_{1}b_{1} + W_{1}a_{1} + e_{1}}$$` `$$\mathbf{y_{2} = X_{2}b_{2} + W_{2}a_{2} + e_{2}}$$` Individuals within traits 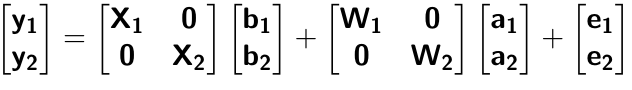 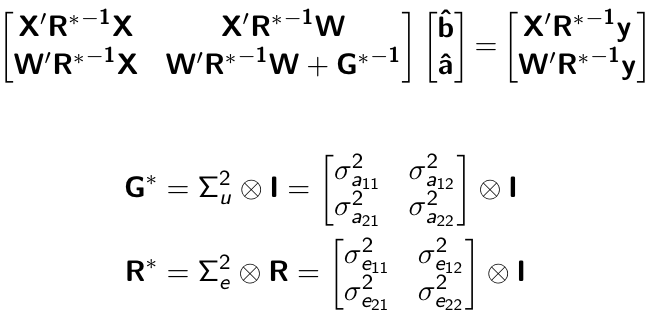 --- # Is multi-trait model useful? GBLUP model - estimate covariance structures `\(\rightarrow\)` genetic correlations - traits with scarce records - traits with low heritability RR-BLUP - increase statistical power to detect QTL regions