STAT 892-004 Integrative Data Science for Plant Phenomics
Homework assignment 1
Due date
Tuesday, January 30, 5pm
R
Data
For this assignment, we are going to use the Orange dataset included in the datasets package. This dataset shows the growth of orange trees. Type ?Orange to learn more about the dataset. Answer the 10 questions below using the Orange dataset.
Question 1
Describe the Orange dataset and explain each column.
Question 2
How many rows and columns are there in this dataset?
Question 3
How many different orange trees and age groups are there in the dataset?
Question 4
What is the mean of the circumference column?
Question 5
What is the variance of the circumference column?
Question 6
Compute the covariance between circumferences of Tree 3 and Tree 5.
Question 7
Compute the correlation between circumferences of Tree 3 and Tree 5.
Question 8
Which tree has the lowest correlation with Tree 1 in terms of circumferences?
Question 9
Use the subset function and find out which orange trees has the largest circumference in the youngest age group.
Question 10
The plot function generates a figure. Learn more about the plot function by typing ?plot. The following code plots the growth of orange trees. Interpret the results.
nTree <- length(unique(Orange$Tree))
plot(Orange[, 2], Orange[, 3], main = "Growth of Orange Trees", xlab = "Age",
    ylab = "Circumference", col = rainbow(nTree)[Orange$Tree], pch = 19, cex = 2)
legend("topleft", title = "Orange Trees", fill = rainbow(nTree), levels(Orange$Tree))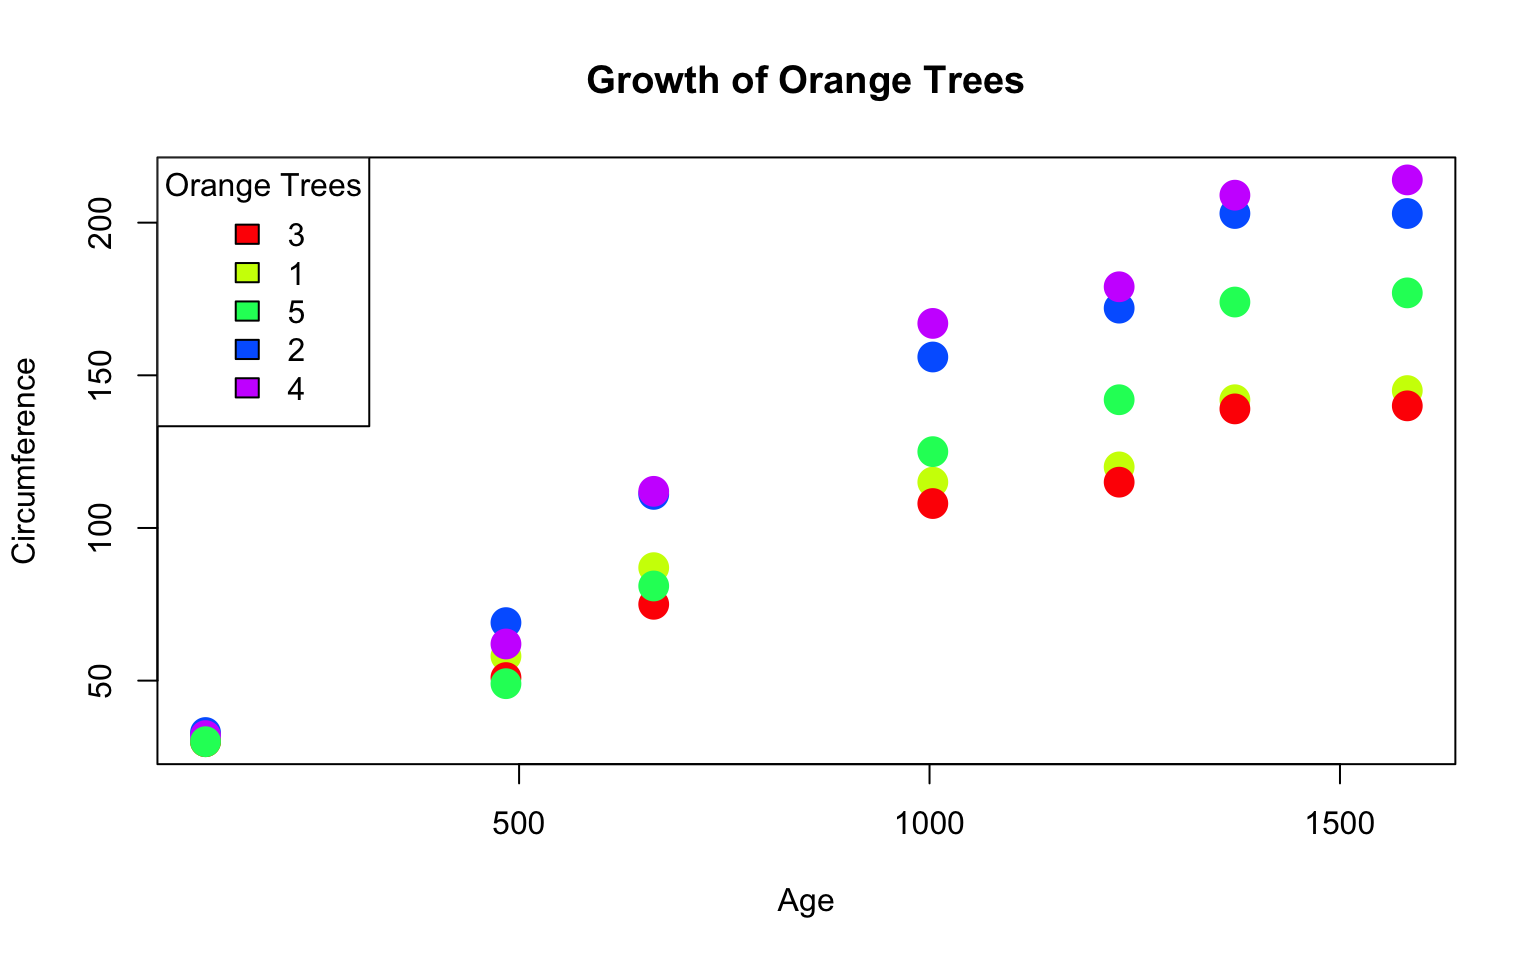
MATLAB
Question 11
Log in to your MathWorks Account, and complete the MATLAB Onramp self-paced training course. After you complete this course, download and submit your progress report.